Python
升级Python版本
在Windows下,使用 conda来安装和管理Python时,使用 conda install python=3.7.1来升级Python到制定的版本号。
更新主要内容
| 库名称 | 加入标准库时的版本号 | 主要功能 |
|---|---|---|
| pathlib | 3.4 | 用于替代原来的 os.path 等底层操作 |
| enum | 3.4 | 枚举类型 |
| statistics | 3.4 | 数值统计函数库 |
| formatted string literals | 3.6 | f’bar {far}’,用于替换 %, format等方法 |
_builtins_
Help on built-in module builtins:
-
NAME builtins - Built-in functions, exceptions, and other objects.
-
DESCRIPTION Noteworthy: None is the
nil' object; Ellipsis represents…’ in slices. - CLASSES
object BaseException Exception ArithmeticError Warning GeneratorExit KeyboardInterrupt SystemExit bytearray bytes classmethod complex dict enumerate filter float frozenset int bool list map memoryview property range reversed set slice staticmethod str super tuple type zip - FUNCTIONS
__build_class__(...)
__import__(...)
abs(x, /)
all(iterable, /)
any(iterable, /)
ascii(obj, /)
bin(number, /)
breakpoint(...)
callable(obj, /)
chr(i, /)
compile(source, filename, mode, flags=0, dont_inherit=False, optimize=-1)
delattr(obj, name, /)
dir(...)
divmod(x, y, /)
eval(source, globals=None, locals=None, /)
exec(source, globals=None, locals=None, /)
format(value, format_spec='', /)
getattr(...)
globals()
hasattr(obj, name, /)
hash(obj, /)
hex(number, /)
id(obj, /)
isinstance(obj, class_or_tuple, /)
issubclass(cls, class_or_tuple, /)
iter(...)
len(obj, /)
locals()
max(...)
min(...)
next(...)
oct(number, /)
open(file, mode='r', buffering=-1, encoding=None, errors=None, newline=None, closefd=True, opener=None)
ord(c, /)
pow(x, y, z=None, /)
print(...)
repr(obj, /)
round(number, ndigits=None)
setattr(obj, name, value, /)
sorted(iterable, /, , key=None, reverse=False)
sum(iterable, start=0, /)
vars(...)
数据类型 type
- bytearray,bytes, complex, float, int, bool
- classmethod, property, staticmethod, type
- dict, list, set, frozenset, range, slice, tuple, str
- enumerate, filter, map, zip
其中,str, tuple 是不可修改对象,dict,list 是可修改对象。
函数 function
Iterators
内置 iter() 函数可以将一个可迭代对象转化为支持 __next__() 协议的对象, 即转化后可以通过 next(it) 来迭代出下一个的元素。
支持迭代器的数据类型有:dict, list, tuples, string, file, set, etc
Generator expression(genexps) and list comprehensions(listcomps)
( expression for expr in sequence1
              if condition1
              for expr2 in sequence2
              if condition2
              for expr3 in sequence3 ...
              if condition3
              for exprN in sequenceN
              if conditionN )
Generators
yield
Build-in functions
map, filter, enumerate, any, all, zip,
itertools module
- 基于一个迭代器生成一个新的迭代器
itertools.count(10)
itertools.cycle([1, 2, 3])
itertools.repeat(elem, [n])
itertools.chain(iterA, iterB)
itertools.islice(iter, [start], stop, [step])
itertools.tee(iter, [n])
- 对迭代器中的元素应用函数
itertools.starmap(func, iter) 用于使用迭代器中的元素来调用函数。如:
itertools.starmap(os.path.join,
  [('/bin', 'python'), ('/usr', 'bin', 'java'),
  ('/usr', 'bin', 'perl'), ('/usr', 'bin', 'ruby')])
=>

/bin/python, /usr/bin/java, /usr/bin/perl, /usr/bin/ruby
常见的函数包为 operator, 如 operator.add(a, b) 等。
- 选择迭代器中元素
itertools.filterfalse(predicate, iter)
itertools.takewhile(predicate, iter)
itertools.dropwhile(predicate, iter)
itertools.compress(data, selectors)
- 组合函数
itertools.combinations(iterable, r) # 组合
itertools.permutations(iterable, r=None) # 排列
- 元素分组
itertools.groupby(iter, key_func=None) 基于 key_func 对迭代器中的元素分组。
The functools module
functools.partial(func, arg1, arg2)
functools.reduce(func, iter, [initial_value]) # 返回最终值

itertools.accumulate(iter, func) # 不返回最终值,而是返回每一个中间结果的迭代器
时间转换
在Python中经常要用到的时间格式的转换,如从字符串转换为日期格式,或是从日期格式转换为字符串,还有时候需要将整数数值型转换为字符串。可以借助于标准库 datetime中的相关函数来实现。
import datetime
d = datetime.datetime.strptime(str(20151231), '%Y%m%d')
函数式编程
map filter zip enumerate range str tuple type
Pandas
浮点数显示格式控制
使用 df.style.fortmat 可以控制 DataFrame 中的不同列的显示格式。
时间序列处理
Pandas 提供了一系列的工具函数来辅助进行时间序列数据的处理,如:
- pd.date_range (时刻序列 timestamp)
- pd.period_range (时期序列)
时刻与时期序列之间还可以相互转化,相关文档参见 http://blog.csdn.net/pipisorry/article/details/52209377
- ts.to_period()
- ps.to_timestamp()
数据结构转换
Pandas中常用的对象主要有DataFrame、Series和Panel,3个不同对象之间提供了相应的方法可以相互转化。
- pd.DataFrame()
- panel.xs()、minor_xs, major_xs
3个对象中比较好用的方法记录如下:
- Series
- value_counts 统计序列中不同值的个数
- size
- DataFrame
- fillna 将
NA替换为缺省值 - sort_index
- groupby([‘year’, ‘sex’])
- pivot_table(‘births’, rows=’year’, cols=’sex’, aggfunc=sum)
- filter(regex = pattern)
- fillna 将
- Panel
- 构造函数
- pd.Panel(data)
- pd.Panel.from_dict(data, orient=’minor’)
- df.to_panel() ** df with a two-level index **
-
改变
axis的数据类型panel.minor_axis = pd.to_datatime(panel.minor_axis, format="%Y%m%d")
- 构造函数
显示格式控制
- 全局显示格式控制
可以通过set_option相关函数来对Pandas的输入和显示效果进行设置,如通过 display.precision 控制项来设置浮点数显示的位数。
pd.set_option('display.precision', 2) # default to 6
- 基于
DataFrame的显示格式控制
可以通过df.style属性来对dataframe的显示格式进行控制,参见DataFrame.style
如下面的代码可以设置以保留两位小数,以逗号为千分位字符的百分比格式来显示:
df.style.format("{:,.2%}")
df.style.format({columnlabel: "{:,.2%}"})
如何对 dataframe 按行来格式化数据呢?
使用 dataframe.style.format 可以用于对 dataframe 中的列数据显示格式进行设置,如上节所示,但其无法按行设置。
下例中使用 dataframe.apply 来对数据格式进行设置(注意:与前一种方法不同,这里改变了实际的数据,而不仅仅是显示的数据。)
s = df[['营收增幅', '三项费用率', '销售费用率', '管理费用率', '财务费用率']].T
percent_formatter = lambda row: ["{:.2%}".format(item) for item in row]
idx = pd.IndexSlice['三项费用率':'财务费用率', :]
s.loc[idx] = s.loc[idx].apply(percent_formatter, axis=1, result_type='broadcast')
根据余额求单月发生额
假设d1是某个指标的dataframe,其中index是时间序列,columns是对应不同机构的某个指标的余额(cumsum),现在需要计算出对应的单月发生额,代码如下:
d2 = d1.set_index([d1.index.year, d1.index.month])
d2.index.names = ['年份', '月份']
d2.groupby(level='年份').diff().fillna(d2)
其中diff会将第一行(1月)的值变换成NA,这不是我们想要的,因此需要使用fillna来对NA值进行替换。
plotly
在使用Pandas进行数据分析研究时,需要用到dataframe.plot的函数来进行绘图,但是用该函数绘图使用中文时需要做特殊的设置,非常不方便。网上看到有推荐使用plotly的,该包可以将生产的图片自动地保存到云上,这样在文档中直接插入对应的链接就可以了。更重要的是,还可以对图像进行动态的更新,而不需要对原有文档进行更新,倒是可以省不少事。
plotly账号信息(在ricequant上的文档中有记录):
通过底层的API来使用plotly比较繁琐,如下面的示例。但是可以通过cufflinks库来辅助直接在dataframe上使用iplot进行画图。但是对于比较复杂的图,折必须通过原始的plotly API来进行画图。
import plotly
import plotly.plotly as py
import plotly.tools as tls
import plotly.graph_objs as go

plotly.offline.init_notebook_mode()

fig = tls.make_subplots(rows=2, cols=1, shared_xaxes=True)

for bank in dfs['净利差']:
    fig.append_trace(go.Scatter(x=data.major_axis, y=dfs['净利差'][bank], name=bank), 1,1)
for bank in dfs['净息差']:
    fig.append_trace(go.Scatter(x=data.major_axis, y=dfs['存贷差'][bank], name=bank), 2,1)

plotly.offline.iplot(fig)
在文章中引用图像
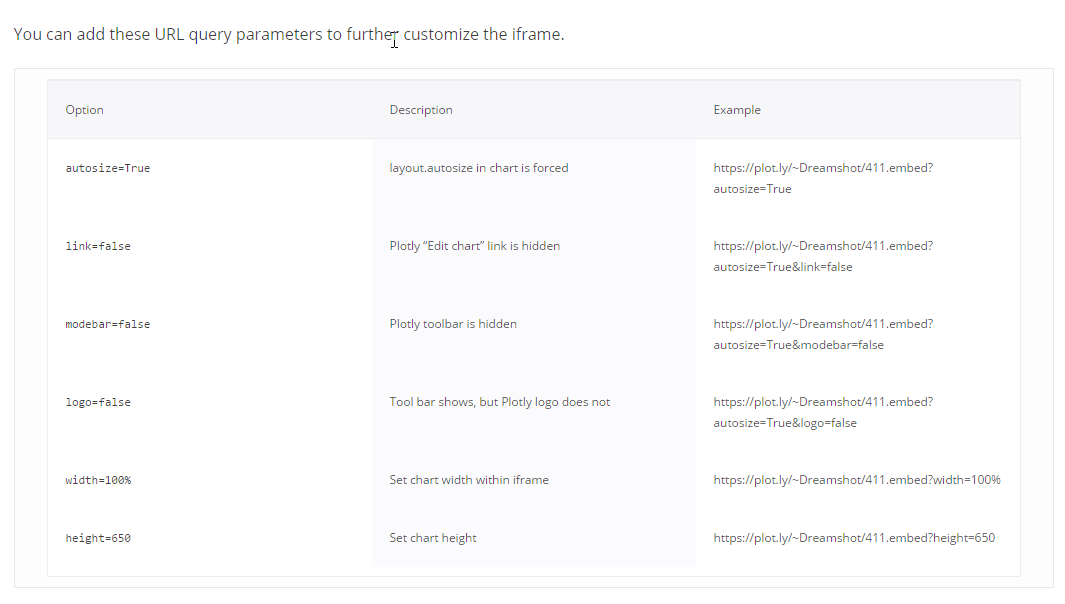
可以通过iframe技术来在文章中直接引用生产的图像文件。
<iframe width="800" height="600" frameborder="0" scrolling="no" src="//plot.ly/~luowenbo/2.embed"></iframe>
并可以用参数来控制图像中的相关元素。

traces & layout
plotly中的两类对象是traces 和 layout。API Reference
调用方法如下:
data = [
    go.Scatter(                         # all "scatter" attributes: https://plot.ly/python/reference/#scatter
        x=[1, 2, 3],                    # more about "x":  /python/reference/#scatter-x
        y=[3, 1, 6],                    # more about "y":  /python/reference/#scatter-y
        marker=dict(                    # marker is an dict, marker keys: /python/reference/#scatter-marker
            color="rgb(16, 32, 77)"     # more about marker's "color": /python/reference/#scatter-marker-color
        )
    ),
    go.Bar(                         # all "bar" chart attributes: /python/reference/#bar
        x=[1, 2, 3],                # more about "x": /python/reference/#bar-x
        y=[3, 1, 6],                # /python/reference/#bar-y
        name="bar chart example"    # /python/reference/#bar-name
    )
]

layout = go.Layout(             # all "layout" attributes: /python/reference/#layout
    title="simple example",     # more about "layout's" "title": /python/reference/#layout-title
    xaxis=dict(                 # all "layout's" "xaxis" attributes: /python/reference/#layout-xaxis
        title="time"            # more about "layout's" "xaxis's" "title": /python/reference/#layout-xaxis-title
    ),
    annotations=[
        dict(                            # all "annotation" attributes: /python/reference/#layout-annotations
            text="simple annotation",    # /python/reference/#layout-annotations-text
            x=0,                         # /python/reference/#layout-annotations-x
            xref="paper",                # /python/reference/#layout-annotations-xref
            y=0,                         # /python/reference/#layout-annotations-y
            yref="paper"                 # /python/reference/#layout-annotations-yref
        )
    ]
)

figure = go.Figure(data=data, layout=layout)

py.plot(figure, filename='api-docs/reference-graph')
设置 YAxis 的显示格式(如将浮点数显示为百分数)
可以通过设置 YAxis 中的 tickformat 来实现
  figure['layout']['yaxis']['tickformat'] = ".2%"
  py.plot(figure)
其中 tickformat 的具体格式参见D3中的Number格式定义。如果不是数字,而是日期,格式定义参见D3中的日期格式定义。
注意,其格式不是 Python 中的规范,而是 D3 的规范。
设置 XAxis 上日期的显示格式
如果日期数据是 ‘20121231’、‘20131231’ 等日期数据时,使用 plotly 生成图形时,默认使用的 tickvals 会使用 ‘20130101’、‘20140101’ 等日期,而不是希望的年末数据。可以通过如下设置可指定对应的 tickvals 和 ticktext。
  figure = df.iplot(asFigure = True)
  figure['layout']['xaxis']['tickvals'] = date_list
  figure['layout']['xaxis']['ticktext'] = formated_date_list
  cf.iplot(figure)
生成静态图片
默认时,plotly 生成动态图形,但是在展示时,对渲染引擎如 notebook 等有较高要求,不方便在静态页面上进行浏览。实际上, plotly 中有多种渲染方法:
import plotly.io as pio
pio.renderers
Renderers configuration
-----------------------
    Default renderer: 'notebook_connected'
    Available renderers:
        ['plotly_mimetype', 'jupyterlab', 'nteract', 'vscode',
         'notebook', 'notebook_connected', 'kaggle', 'azure', 'colab',
         'cocalc', 'databricks', 'json', 'png', 'jpeg', 'jpg', 'svg',
         'pdf', 'browser', 'firefox', 'chrome', 'chromium', 'iframe',
         'iframe_connected', 'sphinx_gallery']
其中,png, jpeg, jpg, svg 为静态渲染器,可以导出为静态图片。不过该渲染器依赖于 orca 库,使用前需要先安装该库。
conda install -c plotly plotly-orca
定制化 renderer
import plotly.io as pio
png_renderer = pio.renderers["png"]
png_renderer.width = 500
png_renderer.height = 500

pio.renderers.default = "png"

import plotly.graph_objects as go
fig = go.Figure(
    data=[go.Bar(y=[2, 1, 3])],
    layout_title_text="A Figure Displayed with the 'png' Renderer"
)
fig.show()
cufflinks
其调用方法为: df.iplot(xTitle='', yTitle='', title='', layout='')。 cufflinks 是基于 plotly 之上的简单封装,其自身并没有提供许多便捷的 API。因此,在需要对生产的图形进行个性化设置时,需要对底层的 plotly 数据接口(结构)进行设置,如下所示:
  figure = df.iplot(asFigure=True)
  # 显示 `figure` 的数据结构
  print figure.to_string()

  figure['data'] = ...
  figure['layout']['legend'] = ...

  # 完成个性化设置后,生成并显示图形
  cf.iplot(figure)
cufflinks也提供了一些方法来生产subplots,如:
df = pd.DataFrame(np.random.rand(10,2), columns=['Col1', 'Col2'] )
df['X'] = pd.Series(['A','A','A','A','A','B','B','B','B','B'])
figs=[df[df['X']==d][['Col1','Col2']].iplot(kind='box',asFigure=True) for d in pd.unique(df['X']) ]
cf.iplot(cf.subplots(figs))
饼图
在使用饼图之前,一定要想想是否合适,可能用其他的图(如柱状头bar)具有更好的表现力。
df.iplot(kind='pie', labels=, values=, hole=0.3, textposition='inside',textinfo='label+percent+value', legend=False)
FAQ
Jupyter
Jupyter Notebook 是一个很方便的学习、研究和文档撰写平台。通过这两天的研究,已经初步掌握了其日常的用法。通过在 Markdown 文档中嵌入 Python 的脚本,可以通过后者来生成动态的图片、表格,甚至还可以增加一些动态的交互效果。
设置主页目录
默认状态下,Notebook 的 HOME 目录设置在当前用户主目录下。该目录混杂了所有用户相关的文件信息,比较杂乱。而且,该目录下的文件没有进行自动云端同步。不同电脑之间的研究文档同步只能通过手动操作,比较繁琐。
更好的解决方案是设置专用的 HOME 目录,并将该目录设置在 OneDrive 下。具体操作过程如下:
- 通过如下命令生成配置文件。
jupyter notebook --generate-config
该命令会在用户主目录下生成一个配置文件: “.jupyter/jupyter_notebook_config.py”
- 在该配置文件中设置文档目录, 注意设置中的双斜线
c.NotebookApp.notebook_dir = u"C:\\Usersi\\CBRC\\OneDrive\\workspace\\investment"
- 重启
Jupyter,就可以看到 HOME 目录已经更新了。